Implements import from the [callgrind format](https://www.valgrind.org/docs/manual/cl-format.html).
This comes with a big caveat that the call graph information contained with callgrind formatted files don't uniquely define a flamegraph, so the generated flamegraph is a best-effort guess. Here's the comment from the top of the main file for the callgrind importer with an examplataion:
```
// https://www.valgrind.org/docs/manual/cl-format.html
//
// Larger example files can be found by searching on github:
// https://github.com/search?q=cfn%3D&type=code
//
// Converting callgrind files into flamegraphs is challenging because callgrind
// formatted profiles contain call graphs with weighted nodes and edges, and
// such a weighted call graph does not uniquely define a flamegraph.
//
// Consider a program that looks like this:
//
// // example.js
// function backup(read) {
// if (read) {
// read()
// } else {
// write()
// }
// }
//
// function start() {
// backup(true)
// }
//
// function end() {
// backup(false)
// }
//
// start()
// end()
//
// Profiling this program might result in a profile that looks like the
// following flame graph defined in Brendan Gregg's plaintext format:
//
// start;backup;read 4
// end;backup;write 4
//
// When we convert this execution into a call-graph, we get the following:
//
// +------------------+ +---------------+
// | start (self: 0) | | end (self: 0) |
// +------------------+ +---------------|
// \ /
// (total: 4) \ / (total: 4)
// v v
// +------------------+
// | backup (self: 0) |
// +------------------+
// / \
// (total: 4) / \ (total: 4)
// v v
// +----------------+ +-----------------+
// | read (self: 4) | | write (self: 4) |
// +----------------+ +-----------------+
//
// In the process of the conversion, we've lost information about the ratio of
// time spent in read v.s. write in the start call v.s. the end call. The
// following flame graph would yield the exact same call-graph, and therefore
// the exact sample call-grind formatted profile:
//
// start;backup;read 3
// start;backup;write 1
// end;backup;read 1
// end;backup;write 3
//
// This is unfortunate, since it means we can't produce a flamegraph that isn't
// potentially lying about the what the actual execution behavior was. To
// produce a flamegraph at all from the call graph representation, we have to
// decide how much weight each sub-call should have. Given that we know the
// total weight of each node, we'll make the incorrect assumption that every
// invocation of a function will have the average distribution of costs among
// the sub-function invocations. In the example given, this means we assume that
// every invocation of backup() is assumed to spend half its time in read() and
// half its time in write().
//
// So the flamegraph we'll produce from the given call-graph will actually be:
//
// start;backup;read 2
// start;backup;write 2
// end;backup;read 2
// end;backup;write 2
//
// A particularly bad consequence is that the resulting flamegraph will suggest
// that there was at some point a call stack that looked like
// strat;backup;write, even though that never happened in the real program
// execution.
```
Fixes#18
The trace event format has a very unfortunate combination of requirements in order to give a best-effort interpretation of a given trace file:
1. Events may be recorded out-of-order by timestamp
2. Events with the *same* timestamp should be processed in the order they were provided in the file. Mostly.
The first requirement is written explicitly [in the spec](https://docs.google.com/document/d/1CvAClvFfyA5R-PhYUmn5OOQtYMH4h6I0nSsKchNAySU/preview).
> The events do not have to be in timestamp-sorted order.
The second one isn't explicitly written, but it's implicitly true because otherwise the interpretation of a file is ambiguous. For example, the following file has all events with the same `ts` field, but re-ordering the fields changes the interpretation.
```
[
{ "pid": 0, "tid": 0, "ph": "X", "ts": 0, "dur": 20, "name": "alpha" },
{ "pid": 0, "tid": 0, "ph": "X", "ts": 0, "dur": 20, "name": "beta" }
}
```
If we allowed arbitrary reordering, it would be ambiguous whether the alpha frame should be nested inside of the beta frame or vice versa. Since traces are interpreted as call trees, it's not okay to just arbitrarily choose.
So you might next guess that a reasonable approach would be to do a [stable sort](https://wiki.c2.com/?StableSort) by "ts", then process the events one-by-one. This almost works, except for two additional problems. The first problem is that in some situations this would still yield invalid results.
```
[
{"pid": 0, "tid": 0, "ph": "B", "name": "alpha", "ts": 0},
{"pid": 0, "tid": 0, "ph": "B", "name": "beta", "ts": 0},
{"pid": 0, "tid": 0, "ph": "E", "name": "alpha", "ts": 1},
{"pid": 0, "tid": 0, "ph": "E", "name": "beta", "ts": 1}
]
```
If we were to follow this rule, we would try to execute the `"E"` for alpha before the `"E"` for beta, even though beta is on the top of the stack. So in *that* case, we actually need to execute the `"E"` for beta first, otherwise the resulting profile is incorrect.
The other problem with this approach of using the stable sort order is the question of how to deal with `"X"` events. speedscope translates `"X"` events into a `"B"` and `"E"` event pair. But where should it put the `"E"` event? Your first guess might be "at the index where the `"X"` events occur in the file". This runs into trouble in cases like this:
```
[
{ "pid": 0, "tid": 0, "ph": "X", "ts": 9, "dur": 1, "name": "beta" },
{ "pid": 0, "tid": 0, "ph": "X", "ts": 9, "dur": 2, "name": "gamma" },
]
```
The most natural translation of this would be to convert it into the following `"B"` and `"E"` events:
```
[
{ "pid": 0, "tid": 0, "ph": "B", "ts": 9, "name": "beta" },
{ "pid": 0, "tid": 0, "ph": "E", "ts": 10, "name": "beta" },
{ "pid": 0, "tid": 0, "ph": "B", "ts": 9, "name": "gamma" },
{ "pid": 0, "tid": 0, "ph": "E", "ts": 11, "name": "gamma" },
]
```
Which, after a stable sort turns into this:
```
[
{ "pid": 0, "tid": 0, "ph": "B", "ts": 9, "name": "beta" },
{ "pid": 0, "tid": 0, "ph": "B", "ts": 9, "name": "gamma" },
{ "pid": 0, "tid": 0, "ph": "E", "ts": 10, "name": "beta" },
{ "pid": 0, "tid": 0, "ph": "E", "ts": 11, "name": "gamma" },
]
```
Notice that we again have a problem where we open "beta" before "gamma", but we need to close "beta" first because it ends first!
Ultimately, I couldn't figure out any sort order that would allow me to predict ahead-of-time what order to process the events in. So instead, I create two event queues: one for `"B"` events, and one for `"E"` events, and then try to be clever about how I merge them together.
AFAICT, chrome://tracing does not sort events before processing them, which is kind of baffling. But chrome://tracing also has really bizarre behaviour for things like this where the resulting flamegraph isn't even a valid tree (there are overlapping ranges):
```
[
{ "pid": 0, "tid": 0, "ph": "X", "ts": 0, "dur": 10, "name": "alpha" },
{ "pid": 0, "tid": 0, "ph": "X", "ts": 5, "dur": 10, "name": "beta" }
}
```
So I'm going to call this "good enough" for now.
Fixes#223Fixes#320
In #273, I changed `CallTreeProfileBuilder.leaveFrame` to fail hard when you request to leave a frame different from the one at the top of the stack. It turns out we were intentionally doing this for trace event imports, because `args` are part of the frame key, and we want to allow profiles to be imported where the `"B"` and `"E"` events have differing `args` field.
This PR fixes the import code to permissively allow the `"args"` field to not match between the `"B"` and `"E"` fields.
**A note on intentional differences between speedscope and chrome://tracing**
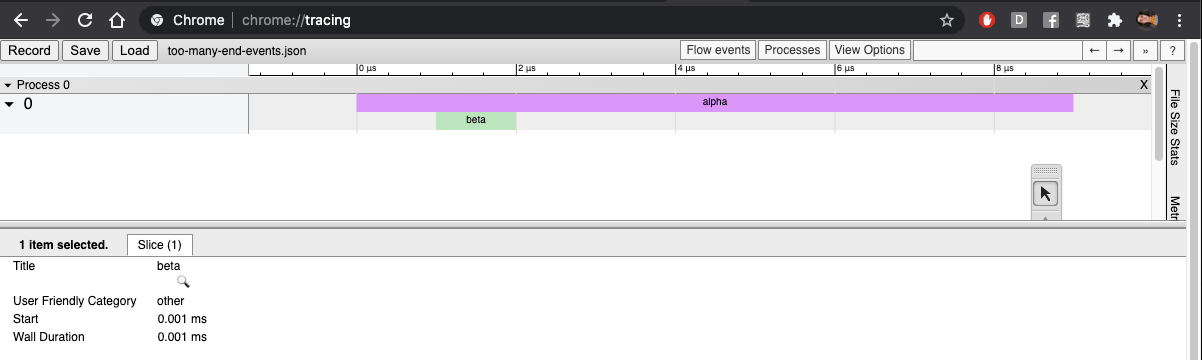
`chrome://tracing` will close whichever frame is at the top when it gets an `"E"` event, regardless of whether the name or the args match. speedscope will ignore the event entirely if the `"name"` field doesn't match, but will warn but still close the frame if the `"name"`s match but the `"args"` don't.
```
[
{"pid": 0, "tid": 0, "ph": "B", "name": "alpha", "ts": 0},
{"pid": 0, "tid": 0, "ph": "B", "name": "beta", "ts": 1},
{"pid": 0, "tid": 0, "ph": "E", "name": "gamma", "ts": 2},
{"pid": 0, "tid": 0, "ph": "E", "name": "beta", "ts": 9},
{"pid": 0, "tid": 0, "ph": "E", "name": "alpha", "ts": 10}
]
```
### speedscope

```
warning: ts=2: Request to end "gamma" when "beta" was on the top of the stack. Doing nothing instead.
```
### chrome://tracing
This PR adds the ability to remap an already-loaded profile using a JavaScript source map. This is useful for e.g. recording minified profiles in production, and then remapping their symbols when the source map isn't made directly available to the browser in production.
This is a bit of a hidden feature. The way it works is to drop a profile into speedscope, then drop the sourcemap file on top of it.
To test this, I used a small project @cricklet made (https://gist.github.com/cricklet/0deaaa7dd63657adb6818f0a52362651), and also tested against speedscope itself.
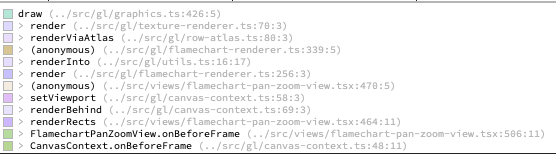
To test against speedscope itself, I profiled loading a file in speedscope in Chrome, then dropped the resulting Chrome timeline profile into speedscope, and dropped speedscope's own sourcemap on top. Before dropping the source map, the symbols look like this:
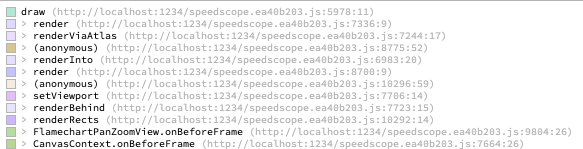
After dropping the source map, they look like this:
I also added automated tests using a small JS bundle constructed with various different JS bundlers to make sure it was doing a sensible thing in each case.
# Background
Remapping symbols in profiles using source-maps proved to be more complex than I originally thought because of an idiosyncrasy of which line & column are referenced for stack frames in browsers. Rather than the line & column referencing the first character of the symbol, they instead reference the opening paren for the function definition.
Here's an example file where it's not immediately apparent which line & column is going to be referenced by each stack frame:
```
class Kludge {
constructor() {
alpha()
}
zap() {
alpha()
}
}
function alpha() {
for (let i = 0; i < 1000; i++) {
beta()
delta()
}
}
function beta() {
for (let i = 0; i < 10; i++) {
gamma()
}
}
const delta = function () {
for (let i = 0; i < 10; i++) {
gamma()
}
}
const gamma =
() => {
let prod = 1
for (let i = 1; i < 1000; i++) {
prod *= i
}
return prod
}
const k = new Kludge()
k.zap()
```
The resulting profile looks like this:
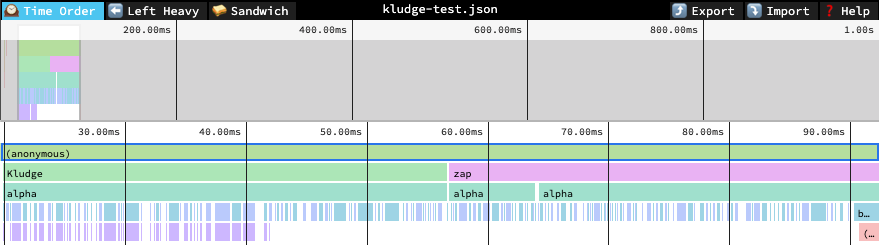
The relevant line & column for each function are...
```
// Kludge: line 2, column 14
class Kludge {
constructor() {
^
...
// zap: line 6, column 6
zap() {
^
...
// alpha: line 11, column 15
function alpha() {
^
...
// delta: line 24, column 24
const delta = function () {
^
...
// gamma: line 31, column 1
const gamma =
() => {
^
```
If we look up the source map entry that corresponds to the opening paren, we'll nearly always get nothing. Instead, we'll look at the entry *preceding* the one which contains the opening paren, and hope that has our symbol name. It seems this works at least some of the time.
Another complication is that some, but not all source maps include the original names of functions. For ones that don't, but do include the original source-code, we try to deduce it ourselves with varying amounts of success.
Supersedes #306Fixes#139
Before this PR, we blindly assumed that all text imported into speedscope was UTF-8 encoded. This, unsurprisingly, is not always true. After this PR, we support text that's UTF-16 encoded, with either the little-endian or big-endian byte-order-mark.
Fixed#291
Closes#294
This adds import for Safari/webkit profiler. Well, for Safari 13.1 for sure, I haven't done any work to check if there's been changes to the syntax.
It seems to work OK, and is already a huge improvement over profiling in Safari (which doesn't even have a flame graph, let alone something like left heavy). Sadly, the sampler resolution is only 1kHz, which is not super useful for a lot of profiling work. I made a ticket on webkit bug tracker to ask for 10kHz/configurable sampling rate: https://bugs.webkit.org/show_bug.cgi?id=214866
Another thing that's missing is that I cut out all the idle time. We could also insert layout/paint samples into the timeline by parsing `events`. But I'll leave that for another time.
<img width="1280" alt="Captura de pantalla 2020-07-28 a las 11 02 06" src="https://user-images.githubusercontent.com/183747/88643560-20c16700-d0c2-11ea-9c73-d9159e68fab9.png">
## Context
Hi! I'm working on an experimental React [concurrent mode profiler](https://react-scheduling-profiler.vercel.app) in partnership with the React core team, and we're using a [custom build of Speedscope](https://github.com/taneliang/speedscope/compare/master...taneliang:fork-for-scheduling-profiler) that exposes Speedscope's internals to support our custom flamechart rendering. Specifically, Speedscope is used to import and process Chrome profiles, which are then fed to our rendering code that draws everything to a canvas.
Here's a screenshot of our app for context. The stuff above the thick gray bar is React data (some React Fiber lanes, React events, and other user timing marks), and a flamechart is drawn below.
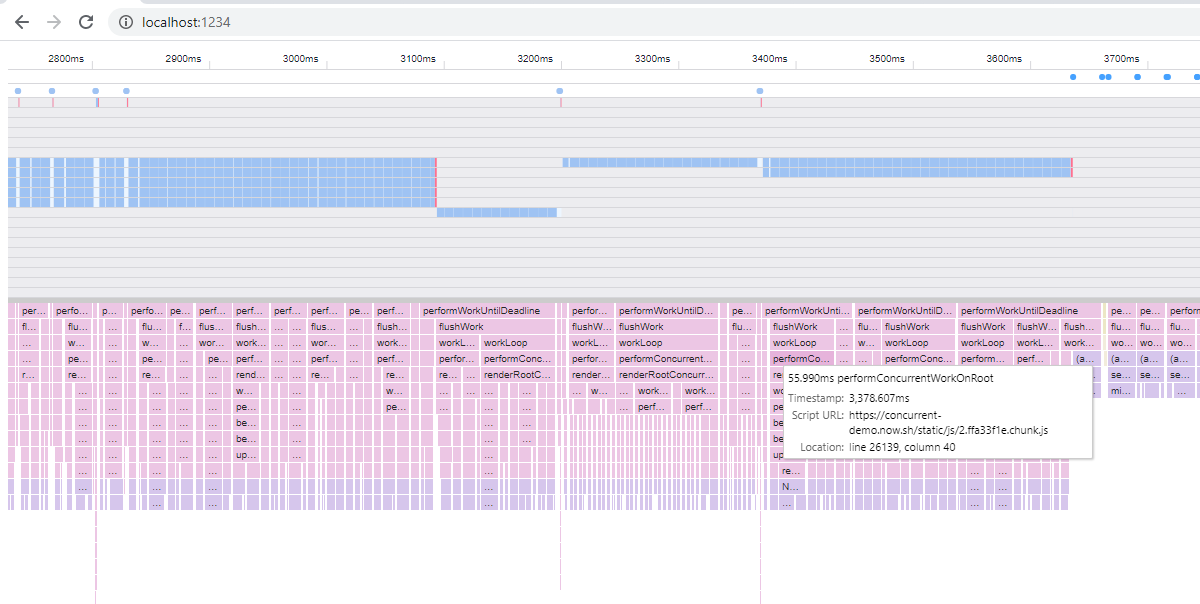
## Problem
Early on, we had [an issue](https://github.com/MLH-Fellowship/scheduling-profiler-prototype/issues/42) where our flamechart was not aligned with the React data. The discrepancy between the flamechart frames and our React data grew over the time of the profile.
We tracked down the cause to https://github.com/jlfwong/speedscope/pull/80, which resolves https://github.com/jlfwong/speedscope/issues/70. It seems like zeroing out those negative time deltas resulted in the accumulation of errors over the time of these profiles, which resulted in the very visible misalignment in our profiler.
I am confident that the React data's timestamps are correct because they are obtained from User Timing marks, which have absolute timestamps and are thus independent of any `timeDelta` stuff. This would mean that Speedscope is likely displaying incorrect timestamps for Chrome profiles.
## Solution
This PR takes a different approach to solving the negative `timeDelta` problem: we add a `lastElapsed` variable as a sort of backstop, preventing `elapsed` from traveling backwards in time, while still ensuring that `elapsed` is always accurate.
We've been using this patch in our custom build for about a month now and it seems to work well.
This implements the next step towards full featured search in speedscope: visual highlighting of matching search results in the time ordered & left heavy views. This doesn't yet add the ability to click prev/next to select the next matching element in the editor, but I'm still planning on doing something like that. I haven't figured out yet what I want the user experience to be like for that.
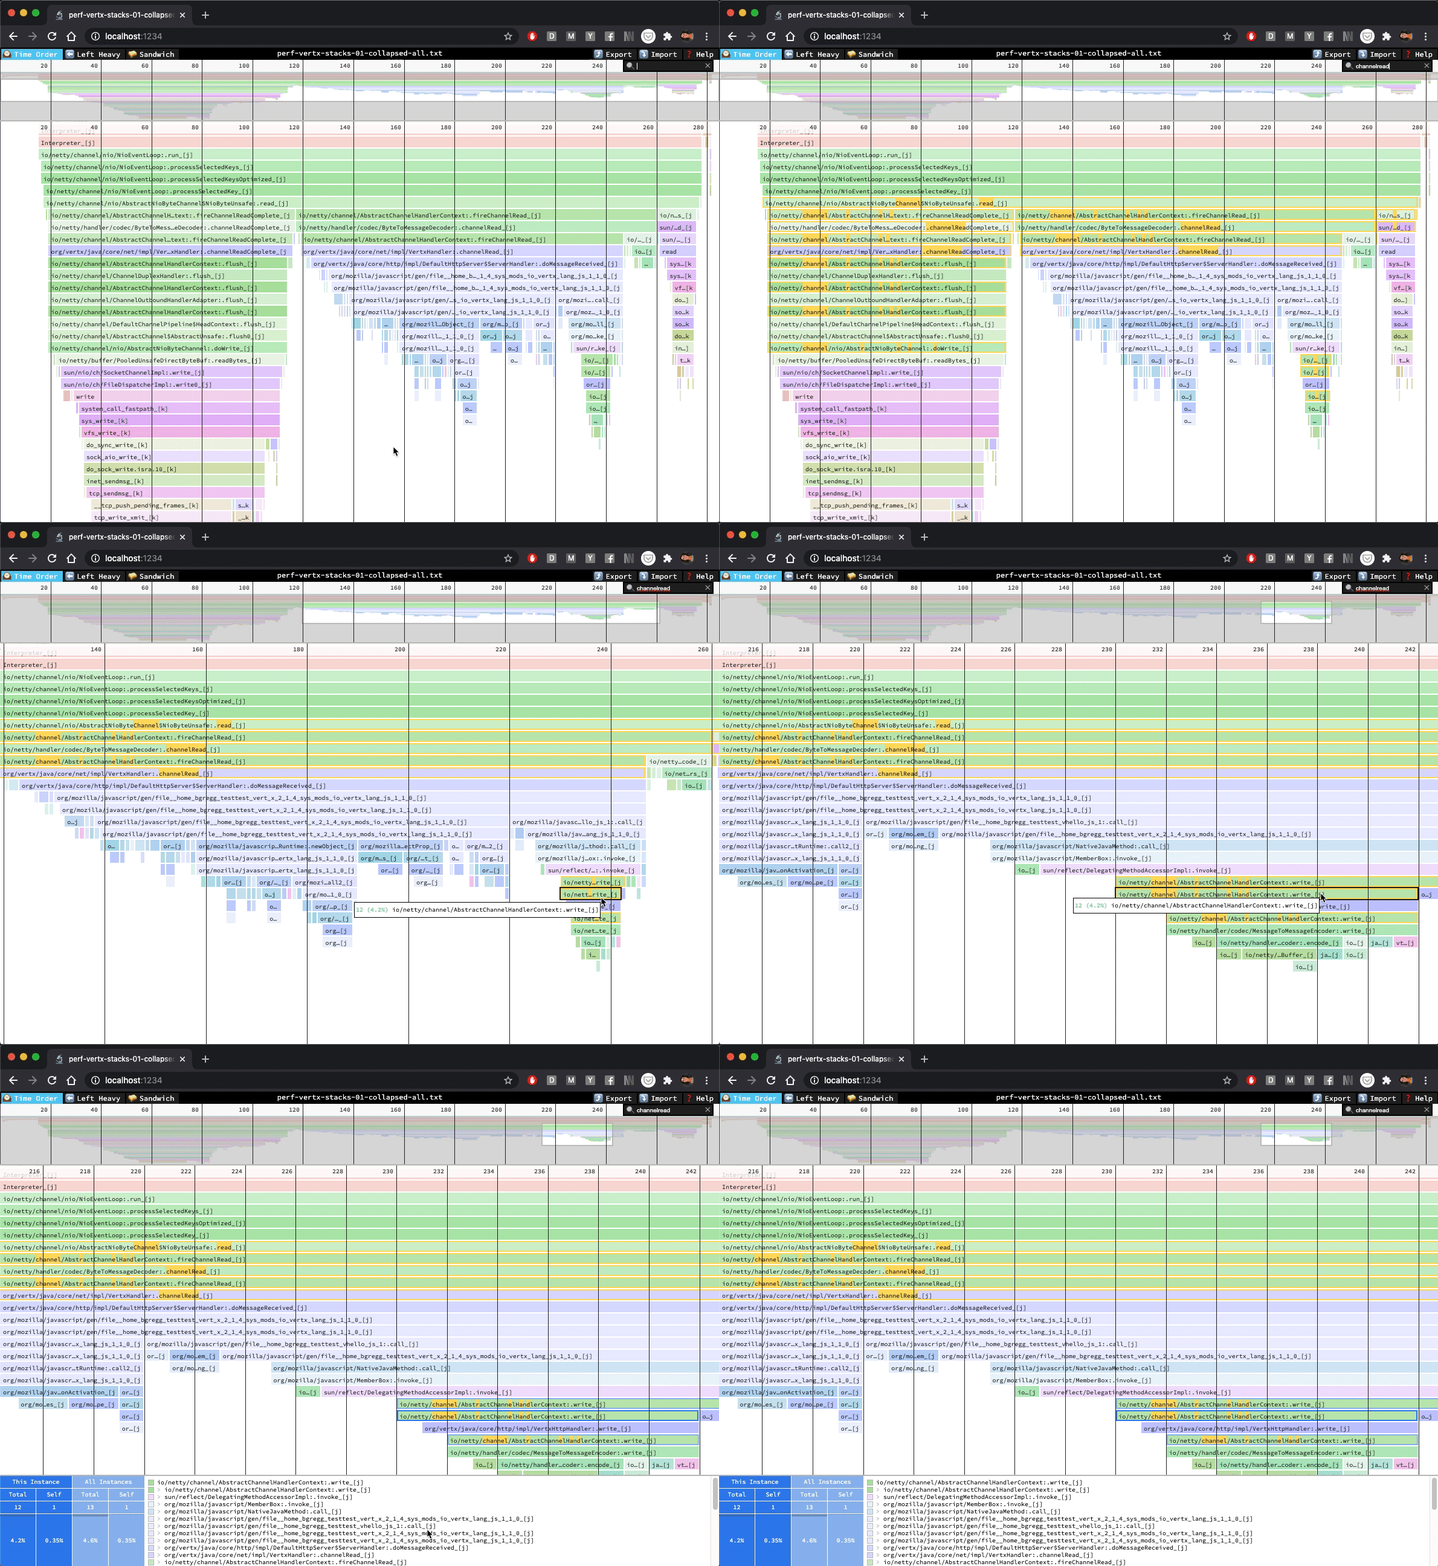
This works towards fixing #38
This fixes two unrelated problems which together caused performance issues in the sandwich view & made hover tooltips appear to be broken.
The first issue was caused by continuously priming the `requestAnimationFrame` loop when it should be a no-op, and the second issue was caused by using different cache keys when trying to access a memoized value in the caller & callee flamegraph components. This resulted in thrash, and especially bad performance because the cache miss was resulting in us re-allocating the WebGL framebuffer on every frame, which is unsurprisingly quite slow.
Fixes#212Fixes#155Fixes#74 (though this was maybe already fixed)
This is the first step towards fixing #38.
I started with the easiest part from a UI-paradigm perspective, and also the place that's the most confusing that search doesn't work. Before this PR, browers' Cmd+F/Ctrl+F would *look* like it worked in the Sandwich view, but they wouldn't work fully because the view in the sandwich view is a virtualized table, meaning that it doesn't put all of the rows in the DOM. Instead, it only renders enough to fill the viewport to make rendering much faster.
Here's what the changes from this PR look like in action:
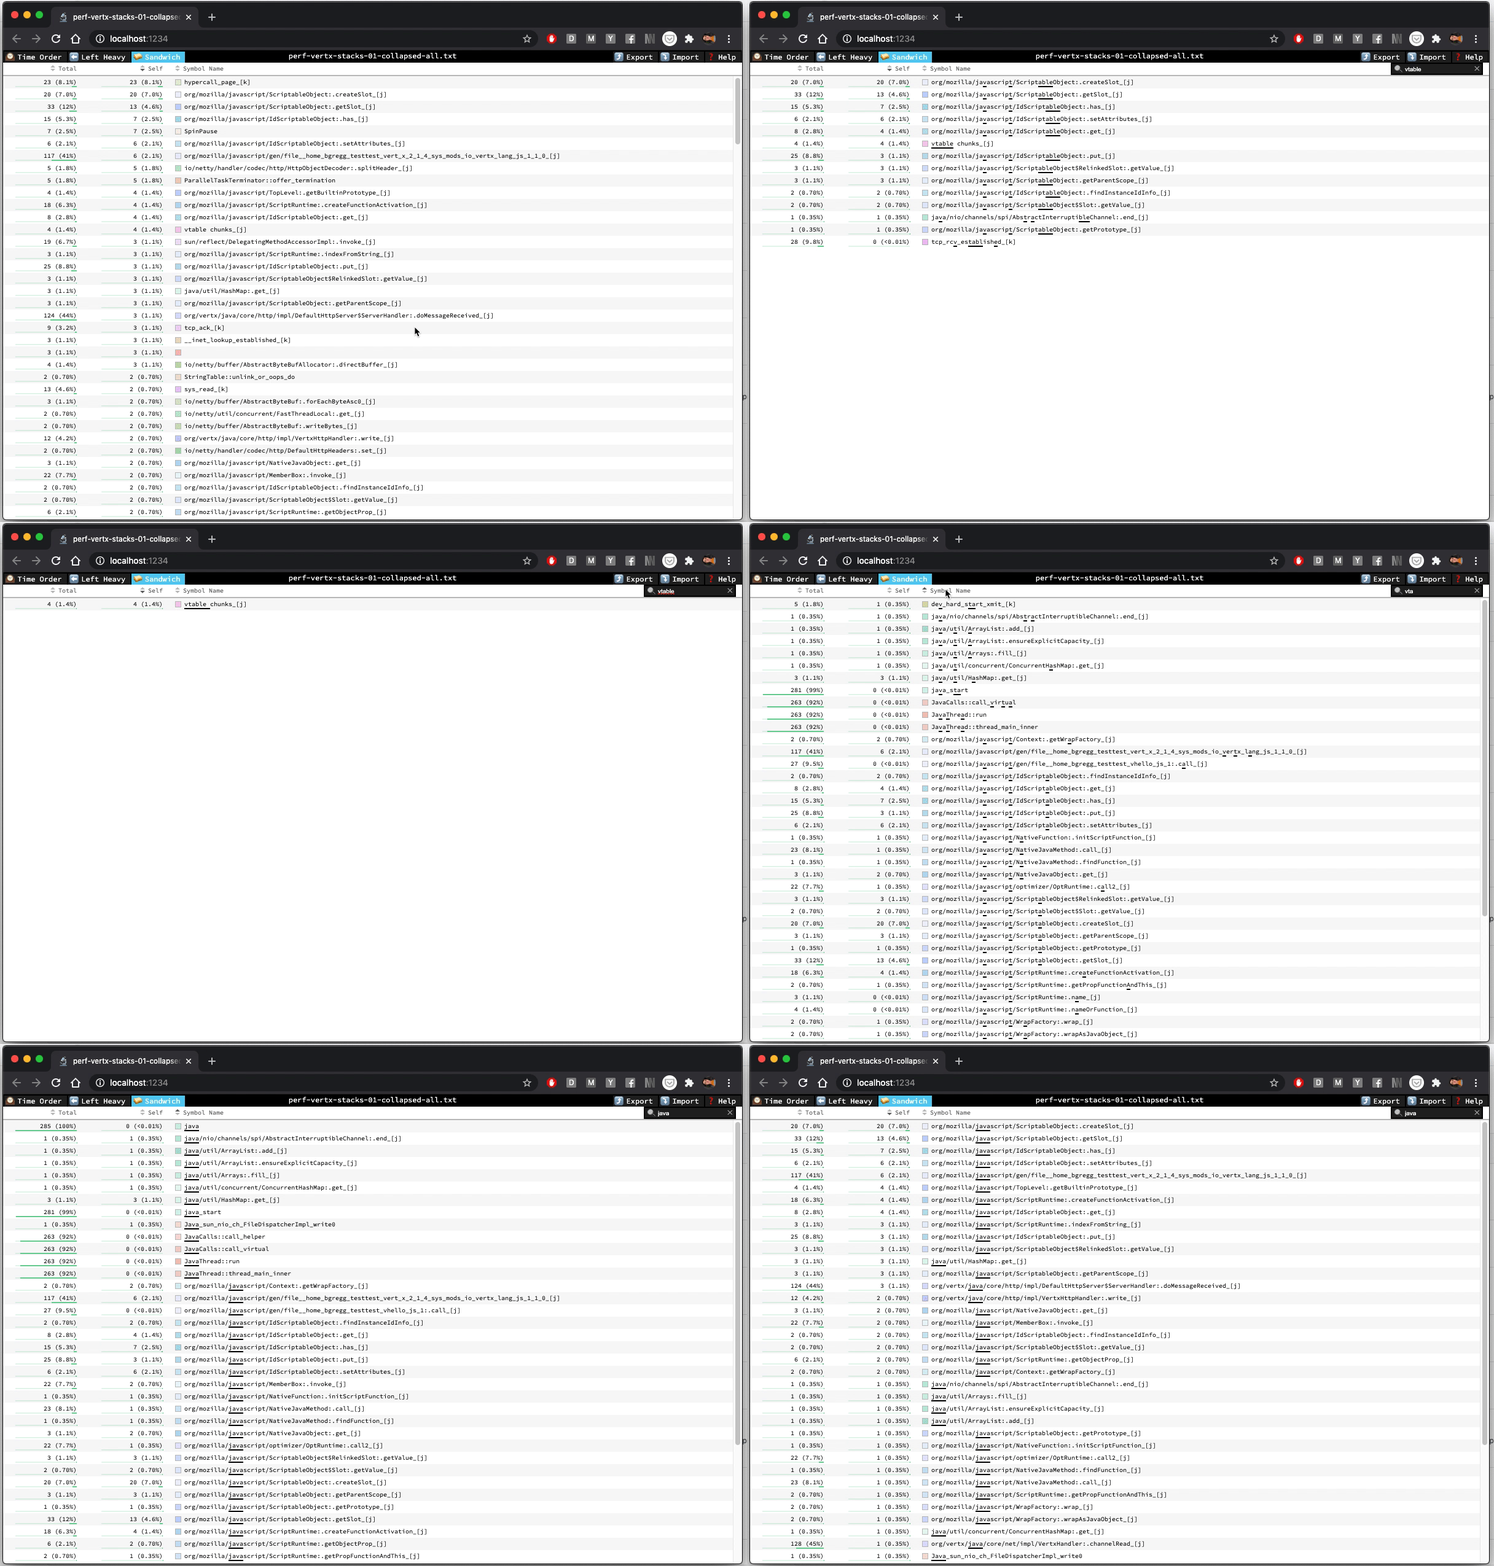
Before closing #38, I'll be adding search functionality to the flamechart views too.
This adds much better UI for selecting different profiles within a single import.
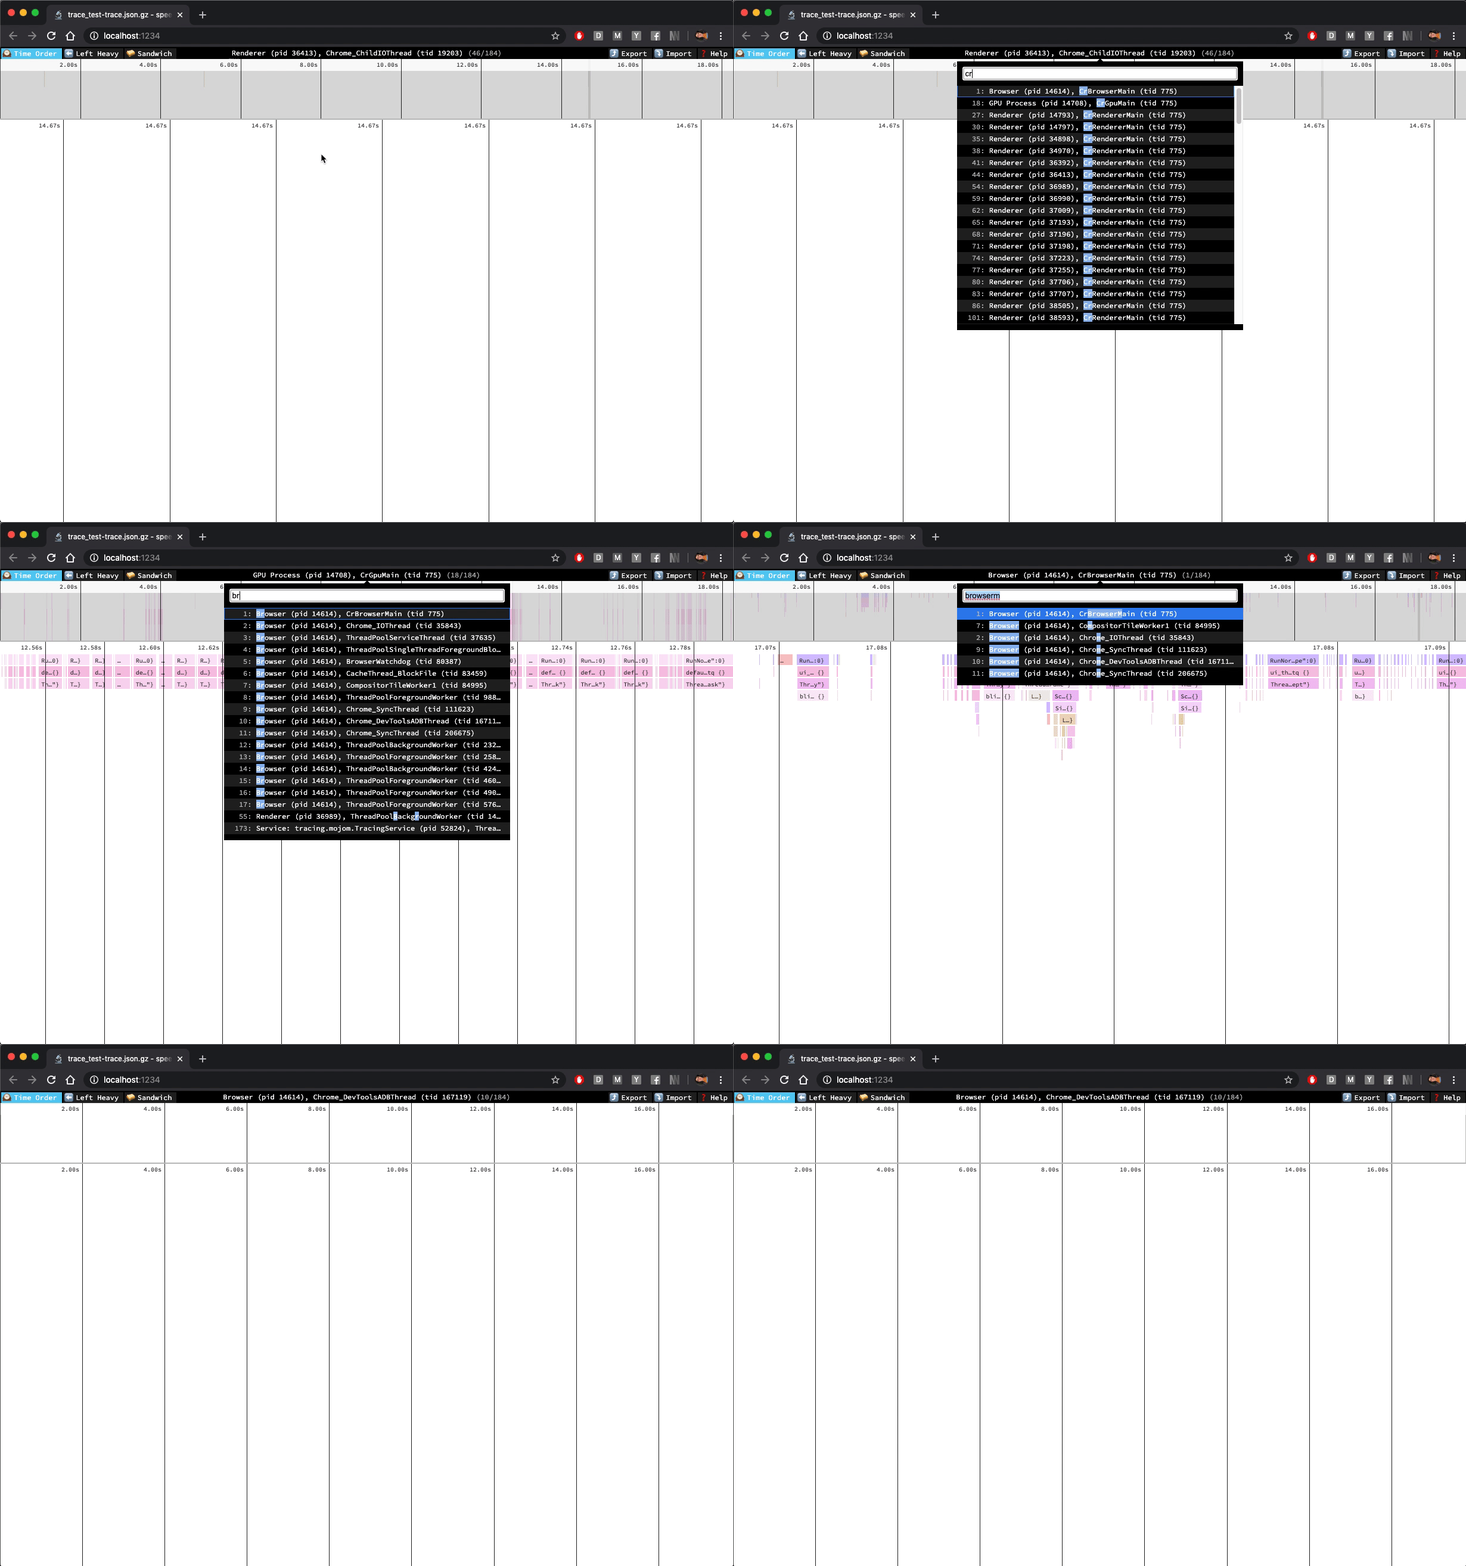
You can now hover over the middle of the toolbar or hit `t` on your keyboard to bring up the profile selector. From there, you can use fuzzy-find to switch to the profile you want, and hit "enter" to select it. The up and down arrow keys can be used while the profile selector filter input is focused to move through the list of profiles.
I think the "next" and "prev" buttons are now totally useless, so I removed them.
Fixes#167
Profile switching was subtly broken because action creators weren't being correctly re-bound due to a missing dependency in a `useCallback` call.
I also tried to reduce boilerplate in this PR by adding additional exhaustive deps protection via eslint for `useSelector`, `useAppSelector`, and `useActionCreator`. The removes the need for using `useCallback` or each of those.
Fixes#280
To test this, load a profile, then save a `.tsx` file locally. Before this change, it would bring you back to the welcome screen after hot reload. After this change, application state is still displayed. This is because before the change, the `setGLCanvas` action wasn't resulting in a re-render because it occurred between the initial render and the `useLayoutEffect` callback.
Fixes#276
I'd like to try writing new components using hooks, and to do that I need to upgrade from preact 8 to preact X.

For reasons that are... complicated, in order to upgrade without breaking part of my build process, I had to remove the dependency on `preact-redux` altogether. This led me to write my own implementation, and as part of that I realized I could remove `createContainer` in favour of some simple hooks that use redux.

Before landing:
- [x] Investigate performance issues in the sandwich views
- [x] Investigate es-lint checks for exhaustive hook dependencies
@JustinBeckwith pointed out in #262 that `npm install` was broken in node 13.x, and @DanielRuf pointed in #254 that test fail for node 11+ because of a change to stability of sorting.

This PR seeks to address both of those.

The installation issue was fixed by just regenerating `package-lock.json` without needing to bump any of the direct dependency versions. The test failure issue requires manual intervention.

To fix the sort stability issue, I updated the tests to use the stable sort values (these were all the correct values, though some of the test values were incorrect).

To make the suite still pass for node 10, I added a hack where I override `Array.prototype.sort` with a stable implementation that's *only* used in tests (See comments in code for a justification for why)

## Test Plan

Before this PR: `npm install` on node 13.x fails & `npm run jest` results in test failures
After this PR: `npm install` on node 13.x passes & `npm run jest` passes for node 10, 12, and 13.
I ended up in a horrible peer dependency hell and apparently needed to bump the versions of quicktype, typescript, ts-jest, *and* jest to get out of it. But I think I got out of it!

Local builds and deployment builds both seem to work after these changes.
The code to import trace formatted events intentionally re-orders events in order to make it easier at flamegraph construction time to order the pushes and pops of frames.

It turns out that this re-ordering results in incorrect flamegraphs being generated as shown in #251.

This PR fixes this by avoiding re-ordering in situations where it isn't necessary.
Apparently Emscripten now generates `.symbols` files where names are not mangled using Clang's mangling scheme, but rather hex-escaped! So 'a\20b' means 'a b'. Currently we can't import these symbol maps into Speedscope because a regex rejects them, and they look weird because we don't unescape.
This PR introduces support for importing JSON based profiles that are missing a terminating `]` (and possibly have an extraneous `,`).
This is similar to #202, but takes a much more targeted and simple approach.
I'm confident that this approach is sufficient because this is exactly what `chrome://tracing` does: 27e047e049/tracing/tracing/extras/importer/trace_event_importer.html (L197-L208)Fixes#204
In #194, I added code to support import of multithreaded profiles from Chrome 70. I'm now doing some profiling work on an older version of Android chrome, and it seems like the profile objects don't yet have `id` properties. Instead, we should try using the `pid/tid` pair to identify profiles when the `id` field is absent.

This was tested against a profile import from Android Chrome 66.
this's will lack `com.apple.xray.owner.template` in instruments archive data where run instruments with command line.
like:
1. run`instruments -t Template.tracetemplate -D demo.trace -l 10000 -w  test.app`
2. drag `demo.trace` into `https://www.speedscope.app`
3. alert `Unrecognized format! See documentation about supported formats`
The spec for the Trace Event Format technically requires that all entries have "ts" values, and they do in the profiles recorded using chrome://tracing. We don't actually use those values in the case of "M" (metadata) events, however, and they're semantically meaningless as far as I can tell, so let's stop requiring them.
This allows the files that @aras-p provided in #77 to import successfully.
Fixes#77
This PR implements basic import of profiles from the "Trace Event Format", which is used by `chrome://tracing`, but also which many other tools target as a convenient event tracing format. The spec can be found here: https://docs.google.com/document/d/1CvAClvFfyA5R-PhYUmn5OOQtYMH4h6I0nSsKchNAySU/preview#heading=h.xqopa5m0e28f.
The standard supports a broad set of events, some of which don't yet have any practical way to visualize them in speedscope. This PR implements support for the `B`, `E`, and `X` events, as well as gathering process and thread names via some of the `M` events.
This work was motivated by a generous donation to /dev/color by @aras-p: https://github.com/jlfwong/speedscope/issues/77#issuecomment-455077014Fixes#77
In #160, I wrote code which incorrectly assumed that at most one profile would be active at a time. It turns out this assumption is incorrect because of webworkers! This PR introduces a fix which correctly separates samples taken on the main thread from samples taken on worker threads, and allows viewing both in speedscope.
Fixes#171
#165 introduced a performance regression by using a really inefficient method for converting from array buffers into string. This should ix it by using `TextDecoder` instead.
Fixes#182 by adding support for importing the JSON profiling format created by GHC's built in profiling support when the executable is passed the `-pj` option. Produces a profile group containing both a time and allocation profile.
Unfortunately, GHC doesn't provide the raw sample information to get the time view to be useful, so only left heavy and sandwich are useful.
Includes a test profile, and I've also tested it on a more real large 2MB profile file in the UI and it works great.
I also modified the Readme to link to a wiki page I'm unable to create, but that should have something like this content copy-pasted into it:
# Importing from Haskell
GHC provides built in profiling support that can export a JSON file.
In order to do this you need to compile your executable with profiling
support and then pass the `-pj` RTS flag to the executable.
This will produce a `my-binary.prof` file in the current directory which
you can import into speedscope.
## Using GHC
See the [GHC manual page on profiling](https://downloads.haskell.org/~ghc/latest/docs/html/users_guide/profiling.html)
for more extensive information on the command line flags available.
```
$ ghc -prof -fprof-auto -rtsopts Main.hs
$ ./Main +RTS -pj -RTS
```
## Using Stack
### With executables
```
$ stack build --profile
$ stack exec -- my-executable +RTS -pj -RTS
```
### With tests
```
stack test --profile --test-arguments "+RTS -pj -RTS"
```
When using #profileURL, some binary characters cannot be read if we use `fetch text`. So I changed that to use `arrayBuffer`.

Now we can read pprof protobuf files and normal JSON files instead of only text files.
This PR adds support for importing from Google's pprof format, which is a gzipped, protobuf encoded file format (that's incredibly well documented!) The [pprof http library](https://golang.org/pkg/net/http/pprof/) also offers an output of the trace file format, which continues to not be supported in speedscope to date (See #77). This will allow importing of profiles generated by the standard library go profiler for analysis of profiles containing heap allocation information, CPU profile information, and a few other things like coroutine creation information.
In order to add support for that a number of dependent bits of functionality were added, which should each provide an easier path for future binary input sources
- A protobuf decoding library was included ([protobufjs](https://www.npmjs.com/package/protobufjs)) which includes both a protobuf parser generator based on a .proto file & TypeScript definition generation from the resulting generated JavaScript file
- More generic binary file import. Before this PR, all supported sources were plaintext, with the exception of Instruments 10 support, which takes a totally different codepath. Now binary file import should work when files are dropped, opened via file browsing, or opened via invocation of the speedscope CLI.
- Transparent gzip decoding of imported files (this means that if you were to gzip compress another JSON file, then importing it should still work fine)
Fixes#60.
--
This is a [donation motivated](https://github.com/jlfwong/speedscope/issues/60#issuecomment-419660710) PR motivated by donations by @davecheney & @jmoiron to [/dev/color](https://www.devcolor.org/welcome) 🎉
It seems like #160 accidentally broken import of profiles in some circumstances from Chrome < 69. Before #160, we always took the first profile in the list *but* the profiles were not sorted chronologically. After #160 but before this PR, we were taking the chronologically first.

After this PR, we always take the chronologically last `CpuProfile` event in the trace.
















