The Austin format conversion tools have been moved to the dedicated austin-python module. The README has been updated to point to the new instructions.
Closes#294
This adds import for Safari/webkit profiler. Well, for Safari 13.1 for sure, I haven't done any work to check if there's been changes to the syntax.
It seems to work OK, and is already a huge improvement over profiling in Safari (which doesn't even have a flame graph, let alone something like left heavy). Sadly, the sampler resolution is only 1kHz, which is not super useful for a lot of profiling work. I made a ticket on webkit bug tracker to ask for 10kHz/configurable sampling rate: https://bugs.webkit.org/show_bug.cgi?id=214866
Another thing that's missing is that I cut out all the idle time. We could also insert layout/paint samples into the timeline by parsing `events`. But I'll leave that for another time.
<img width="1280" alt="Captura de pantalla 2020-07-28 a las 11 02 06" src="https://user-images.githubusercontent.com/183747/88643560-20c16700-d0c2-11ea-9c73-d9159e68fab9.png">
This adds much better UI for selecting different profiles within a single import.
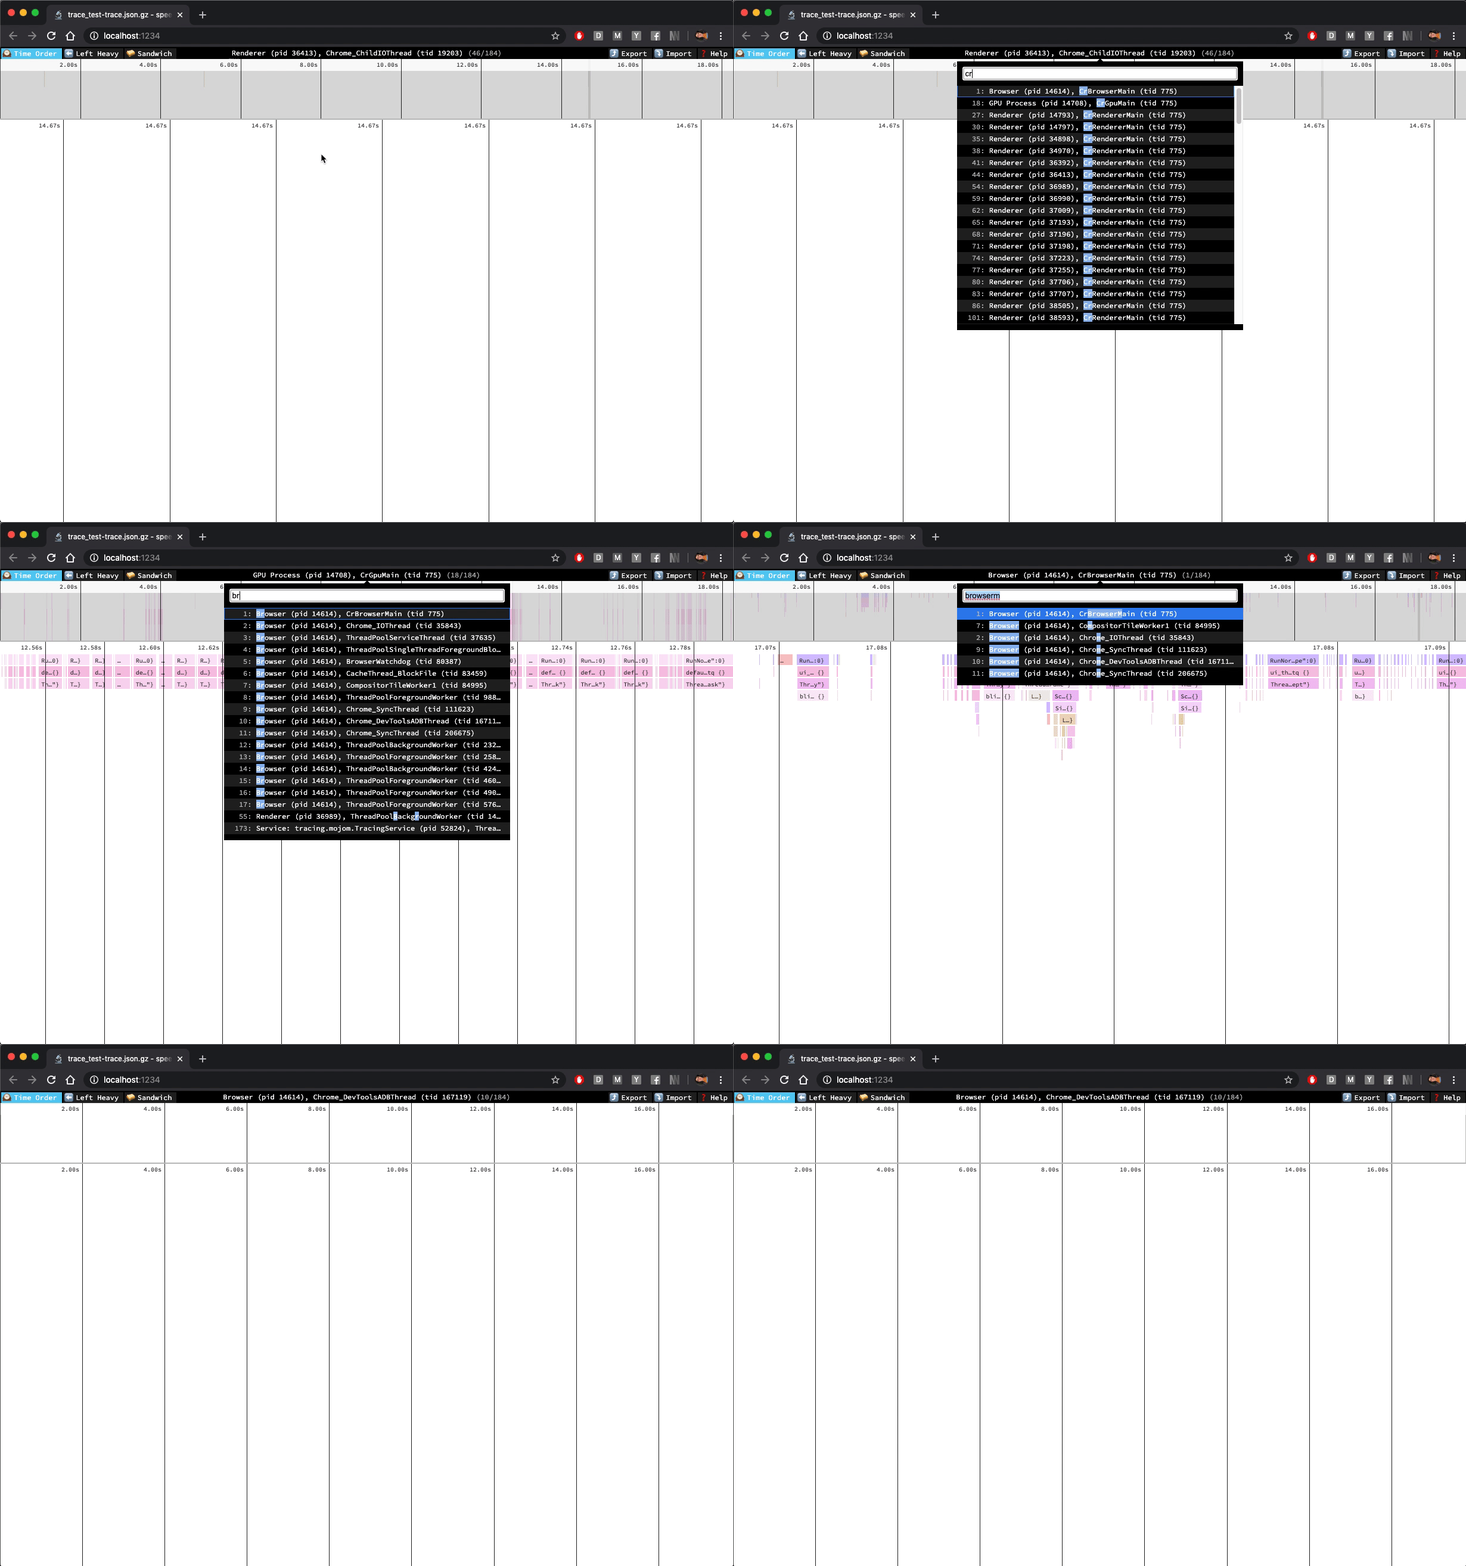
You can now hover over the middle of the toolbar or hit `t` on your keyboard to bring up the profile selector. From there, you can use fuzzy-find to switch to the profile you want, and hit "enter" to select it. The up and down arrow keys can be used while the profile selector filter input is focused to move through the list of profiles.
I think the "next" and "prev" buttons are now totally useless, so I removed them.
Fixes#167
Fixes#182 by adding support for importing the JSON profiling format created by GHC's built in profiling support when the executable is passed the `-pj` option. Produces a profile group containing both a time and allocation profile.
Unfortunately, GHC doesn't provide the raw sample information to get the time view to be useful, so only left heavy and sandwich are useful.
Includes a test profile, and I've also tested it on a more real large 2MB profile file in the UI and it works great.
I also modified the Readme to link to a wiki page I'm unable to create, but that should have something like this content copy-pasted into it:
# Importing from Haskell
GHC provides built in profiling support that can export a JSON file.
In order to do this you need to compile your executable with profiling
support and then pass the `-pj` RTS flag to the executable.
This will produce a `my-binary.prof` file in the current directory which
you can import into speedscope.
## Using GHC
See the [GHC manual page on profiling](https://downloads.haskell.org/~ghc/latest/docs/html/users_guide/profiling.html)
for more extensive information on the command line flags available.
```
$ ghc -prof -fprof-auto -rtsopts Main.hs
$ ./Main +RTS -pj -RTS
```
## Using Stack
### With executables
```
$ stack build --profile
$ stack exec -- my-executable +RTS -pj -RTS
```
### With tests
```
stack test --profile --test-arguments "+RTS -pj -RTS"
```
More broadly, this just supports multiple profiles loaded into the editor in the same time, which supports import from profiles which are multithreaded by importing each thread as a different profile.
For now, the only two file formats that support multiprocess import are Instruments .trace files and speedscope's own file format
In the process of doing this, I refactored the container code considerably and extracted all the dispatch calls into containers rather than them being part of the non-container view code. This is nice because it means that views don't have to be aware of which Flamechart they are or which profile index is being operated upon.
Fixes#66Fixes#82Fixes#91
This PR add a CLI speedscope which load file given as an argument in your default browser. Expected usage looks like:
```
speedscope /path/to/profile
```
Note that since we're using base64 encoded strings as a transport for this, this won't work with multi-file profiles, like the Instruments .trace files. This could be augmented to support that by archiving the contents, but that can be handled in a different PR.
This PR also set up a viable model for integrating speedscope into other projects. By replicating the contents of `cli.js` in other languages, integration should be possible in other languages with no dependency upon node in any way. Distribution should consist of just HTML, JS, and CSS assets to be loaded in browser.
Test Plan:
- Ran the following to simulate a publish & subsequent installation:
```
$ npm pack
$ mv speedscope-0.1.0.tgz /tmp/
$ cd /tmp
$ tar -xvvf speedscope-0.1.0.tgz
$ cd package
$ npm install --only=production
$ ./cli.js
Opening file:///private/tmp/package/dist/release/index.html in your default browser
$ ./cli.js ~/code/speedscope/sample/profiles/Chrome/65/timeline.json
Creating temp file /var/folders/l0/qtd9z14973s2tw81vmzwkyp00000gp/T/speedscope-1531023992823-3880.js
Creating temp file /var/folders/l0/qtd9z14973s2tw81vmzwkyp00000gp/T/speedscope-1531023992823-3880.html
Opening file:///var/folders/l0/qtd9z14973s2tw81vmzwkyp00000gp/T/speedscope-1531023992823-3880.html in your default browser
```
Fixes#24
This defines a JSON-based file format for speedscope.
The motivation for is primarily two things:
1. To enable others to write tools to output profiles which can be read by speedscope
2. To enable others to write tools to handle the output of speedscope, leveraging the variety of importers that speedscope supports
Fixes#65
On init, we check the hash fragment for these parameters and load the URL. We
always show a loading state in that case rather than the landing screen.

When determining the title, an explicitly-specified title takes precedence,
otherwise we use the filename.

I also added an error state, currently only used for my new code, but possibly
there could be a more robust or widespread error handling approach in the
future.
 Gabriele N. Tornetta




