The trace event format has a very unfortunate combination of requirements in order to give a best-effort interpretation of a given trace file:
1. Events may be recorded out-of-order by timestamp
2. Events with the *same* timestamp should be processed in the order they were provided in the file. Mostly.
The first requirement is written explicitly [in the spec](https://docs.google.com/document/d/1CvAClvFfyA5R-PhYUmn5OOQtYMH4h6I0nSsKchNAySU/preview).
> The events do not have to be in timestamp-sorted order.
The second one isn't explicitly written, but it's implicitly true because otherwise the interpretation of a file is ambiguous. For example, the following file has all events with the same `ts` field, but re-ordering the fields changes the interpretation.
```
[
{ "pid": 0, "tid": 0, "ph": "X", "ts": 0, "dur": 20, "name": "alpha" },
{ "pid": 0, "tid": 0, "ph": "X", "ts": 0, "dur": 20, "name": "beta" }
}
```
If we allowed arbitrary reordering, it would be ambiguous whether the alpha frame should be nested inside of the beta frame or vice versa. Since traces are interpreted as call trees, it's not okay to just arbitrarily choose.
So you might next guess that a reasonable approach would be to do a [stable sort](https://wiki.c2.com/?StableSort) by "ts", then process the events one-by-one. This almost works, except for two additional problems. The first problem is that in some situations this would still yield invalid results.
```
[
{"pid": 0, "tid": 0, "ph": "B", "name": "alpha", "ts": 0},
{"pid": 0, "tid": 0, "ph": "B", "name": "beta", "ts": 0},
{"pid": 0, "tid": 0, "ph": "E", "name": "alpha", "ts": 1},
{"pid": 0, "tid": 0, "ph": "E", "name": "beta", "ts": 1}
]
```
If we were to follow this rule, we would try to execute the `"E"` for alpha before the `"E"` for beta, even though beta is on the top of the stack. So in *that* case, we actually need to execute the `"E"` for beta first, otherwise the resulting profile is incorrect.
The other problem with this approach of using the stable sort order is the question of how to deal with `"X"` events. speedscope translates `"X"` events into a `"B"` and `"E"` event pair. But where should it put the `"E"` event? Your first guess might be "at the index where the `"X"` events occur in the file". This runs into trouble in cases like this:
```
[
{ "pid": 0, "tid": 0, "ph": "X", "ts": 9, "dur": 1, "name": "beta" },
{ "pid": 0, "tid": 0, "ph": "X", "ts": 9, "dur": 2, "name": "gamma" },
]
```
The most natural translation of this would be to convert it into the following `"B"` and `"E"` events:
```
[
{ "pid": 0, "tid": 0, "ph": "B", "ts": 9, "name": "beta" },
{ "pid": 0, "tid": 0, "ph": "E", "ts": 10, "name": "beta" },
{ "pid": 0, "tid": 0, "ph": "B", "ts": 9, "name": "gamma" },
{ "pid": 0, "tid": 0, "ph": "E", "ts": 11, "name": "gamma" },
]
```
Which, after a stable sort turns into this:
```
[
{ "pid": 0, "tid": 0, "ph": "B", "ts": 9, "name": "beta" },
{ "pid": 0, "tid": 0, "ph": "B", "ts": 9, "name": "gamma" },
{ "pid": 0, "tid": 0, "ph": "E", "ts": 10, "name": "beta" },
{ "pid": 0, "tid": 0, "ph": "E", "ts": 11, "name": "gamma" },
]
```
Notice that we again have a problem where we open "beta" before "gamma", but we need to close "beta" first because it ends first!
Ultimately, I couldn't figure out any sort order that would allow me to predict ahead-of-time what order to process the events in. So instead, I create two event queues: one for `"B"` events, and one for `"E"` events, and then try to be clever about how I merge them together.
AFAICT, chrome://tracing does not sort events before processing them, which is kind of baffling. But chrome://tracing also has really bizarre behaviour for things like this where the resulting flamegraph isn't even a valid tree (there are overlapping ranges):
```
[
{ "pid": 0, "tid": 0, "ph": "X", "ts": 0, "dur": 10, "name": "alpha" },
{ "pid": 0, "tid": 0, "ph": "X", "ts": 5, "dur": 10, "name": "beta" }
}
```
So I'm going to call this "good enough" for now.
Fixes#223Fixes#320
In #273, I changed `CallTreeProfileBuilder.leaveFrame` to fail hard when you request to leave a frame different from the one at the top of the stack. It turns out we were intentionally doing this for trace event imports, because `args` are part of the frame key, and we want to allow profiles to be imported where the `"B"` and `"E"` events have differing `args` field.
This PR fixes the import code to permissively allow the `"args"` field to not match between the `"B"` and `"E"` fields.
**A note on intentional differences between speedscope and chrome://tracing**
`chrome://tracing` will close whichever frame is at the top when it gets an `"E"` event, regardless of whether the name or the args match. speedscope will ignore the event entirely if the `"name"` field doesn't match, but will warn but still close the frame if the `"name"`s match but the `"args"` don't.
```
[
{"pid": 0, "tid": 0, "ph": "B", "name": "alpha", "ts": 0},
{"pid": 0, "tid": 0, "ph": "B", "name": "beta", "ts": 1},
{"pid": 0, "tid": 0, "ph": "E", "name": "gamma", "ts": 2},
{"pid": 0, "tid": 0, "ph": "E", "name": "beta", "ts": 9},
{"pid": 0, "tid": 0, "ph": "E", "name": "alpha", "ts": 10}
]
```
### speedscope

```
warning: ts=2: Request to end "gamma" when "beta" was on the top of the stack. Doing nothing instead.
```
### chrome://tracing
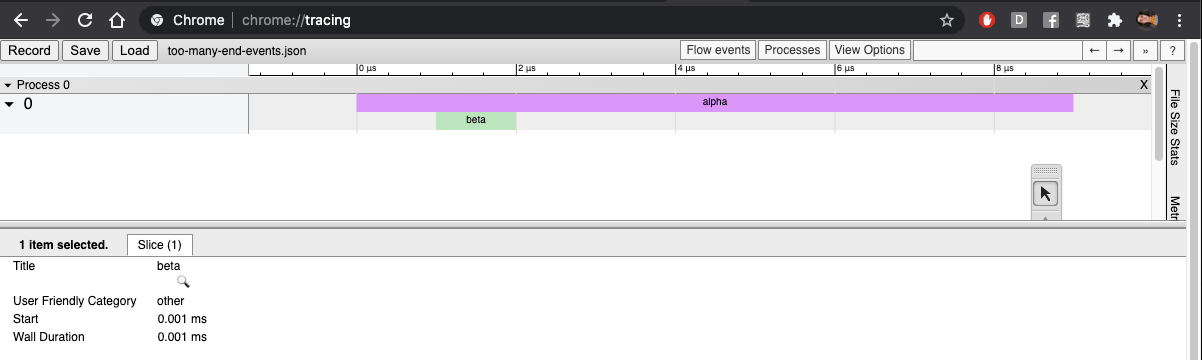
The code to import trace formatted events intentionally re-orders events in order to make it easier at flamegraph construction time to order the pushes and pops of frames.

It turns out that this re-ordering results in incorrect flamegraphs being generated as shown in #251.

This PR fixes this by avoiding re-ordering in situations where it isn't necessary.
The spec for the Trace Event Format technically requires that all entries have "ts" values, and they do in the profiles recorded using chrome://tracing. We don't actually use those values in the case of "M" (metadata) events, however, and they're semantically meaningless as far as I can tell, so let's stop requiring them.
This allows the files that @aras-p provided in #77 to import successfully.
Fixes#77
This PR implements basic import of profiles from the "Trace Event Format", which is used by `chrome://tracing`, but also which many other tools target as a convenient event tracing format. The spec can be found here: https://docs.google.com/document/d/1CvAClvFfyA5R-PhYUmn5OOQtYMH4h6I0nSsKchNAySU/preview#heading=h.xqopa5m0e28f.
The standard supports a broad set of events, some of which don't yet have any practical way to visualize them in speedscope. This PR implements support for the `B`, `E`, and `X` events, as well as gathering process and thread names via some of the `M` events.
This work was motivated by a generous donation to /dev/color by @aras-p: https://github.com/jlfwong/speedscope/issues/77#issuecomment-455077014Fixes#77
 Jamie Wong

