This PR adds the ability to remap an already-loaded profile using a JavaScript source map. This is useful for e.g. recording minified profiles in production, and then remapping their symbols when the source map isn't made directly available to the browser in production.
This is a bit of a hidden feature. The way it works is to drop a profile into speedscope, then drop the sourcemap file on top of it.
To test this, I used a small project @cricklet made (https://gist.github.com/cricklet/0deaaa7dd63657adb6818f0a52362651), and also tested against speedscope itself.
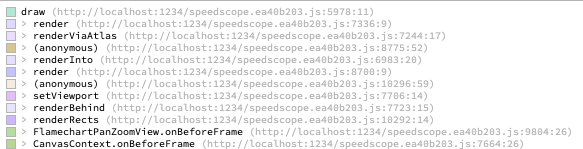
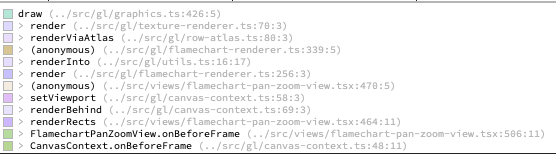
To test against speedscope itself, I profiled loading a file in speedscope in Chrome, then dropped the resulting Chrome timeline profile into speedscope, and dropped speedscope's own sourcemap on top. Before dropping the source map, the symbols look like this:
After dropping the source map, they look like this:
I also added automated tests using a small JS bundle constructed with various different JS bundlers to make sure it was doing a sensible thing in each case.
# Background
Remapping symbols in profiles using source-maps proved to be more complex than I originally thought because of an idiosyncrasy of which line & column are referenced for stack frames in browsers. Rather than the line & column referencing the first character of the symbol, they instead reference the opening paren for the function definition.
Here's an example file where it's not immediately apparent which line & column is going to be referenced by each stack frame:
```
class Kludge {
constructor() {
alpha()
}
zap() {
alpha()
}
}
function alpha() {
for (let i = 0; i < 1000; i++) {
beta()
delta()
}
}
function beta() {
for (let i = 0; i < 10; i++) {
gamma()
}
}
const delta = function () {
for (let i = 0; i < 10; i++) {
gamma()
}
}
const gamma =
() => {
let prod = 1
for (let i = 1; i < 1000; i++) {
prod *= i
}
return prod
}
const k = new Kludge()
k.zap()
```
The resulting profile looks like this:
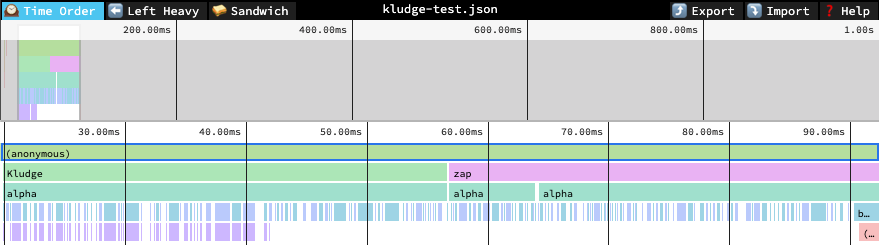
The relevant line & column for each function are...
```
// Kludge: line 2, column 14
class Kludge {
constructor() {
^
...
// zap: line 6, column 6
zap() {
^
...
// alpha: line 11, column 15
function alpha() {
^
...
// delta: line 24, column 24
const delta = function () {
^
...
// gamma: line 31, column 1
const gamma =
() => {
^
```
If we look up the source map entry that corresponds to the opening paren, we'll nearly always get nothing. Instead, we'll look at the entry *preceding* the one which contains the opening paren, and hope that has our symbol name. It seems this works at least some of the time.
Another complication is that some, but not all source maps include the original names of functions. For ones that don't, but do include the original source-code, we try to deduce it ourselves with varying amounts of success.
Supersedes #306Fixes#139
In #160, I wrote code which incorrectly assumed that at most one profile would be active at a time. It turns out this assumption is incorrect because of webworkers! This PR introduces a fix which correctly separates samples taken on the main thread from samples taken on worker threads, and allows viewing both in speedscope.
Fixes#171
This PR fixes#159, and also fixes various small things about how profiles were imported for previous versions of Chrome & for Firefox.
The Chrome 69 format splits profiles across several [Trace Event Format](https://docs.google.com/document/d/1CvAClvFfyA5R-PhYUmn5OOQtYMH4h6I0nSsKchNAySU/preview) events. There are two relevant events: "Profile" and "ProfileChunk". At first read through a profile, it seems like profiles are incorrectly terminated, but it seems like the cause of that is that, for whatever reason, events in the event log are not always sorted in chronological order. If sorted chronologically, then the event sequence can be parsed sensibly.
In the process of looking at this information, I also discovered that speedscope's chrome importer was incorrectly interpreting the value of the first element in `timeDeltas` array. It's intended to be the elapsed time since the start of the profile, not the time between the first pair of samples. This changes the weight attributed to the first sample.
This should help keep things organized as speedscope supports more languages & more formats

Test Plan: Try importing from every single file type, see that the link to load the example profile still works



